Every visitor to your website is on a journey. Some are just discovering you exist. Others are comparing options. A few are ready to buy right now. The website tracking funnel maps these stages so you can measure what is working, spot where people drop off, and fix the leaks that cost you conversions.
If you have ever looked at your analytics and wondered why 10,000 visitors only produced 50 sales, the answer is in your funnel. Somewhere between the first pageview and the final purchase, 99.5% of those visitors decided to leave. A well-measured funnel tells you exactly where — and more importantly, gives you data to do something about it.
This guide covers the complete tracking funnel from awareness to conversion. I will walk you through the metrics that matter at each stage, how to build your funnel with privacy-first analytics tools, and how to diagnose and fix the leaks that drain your revenue.
What Is a Website Tracking Funnel?
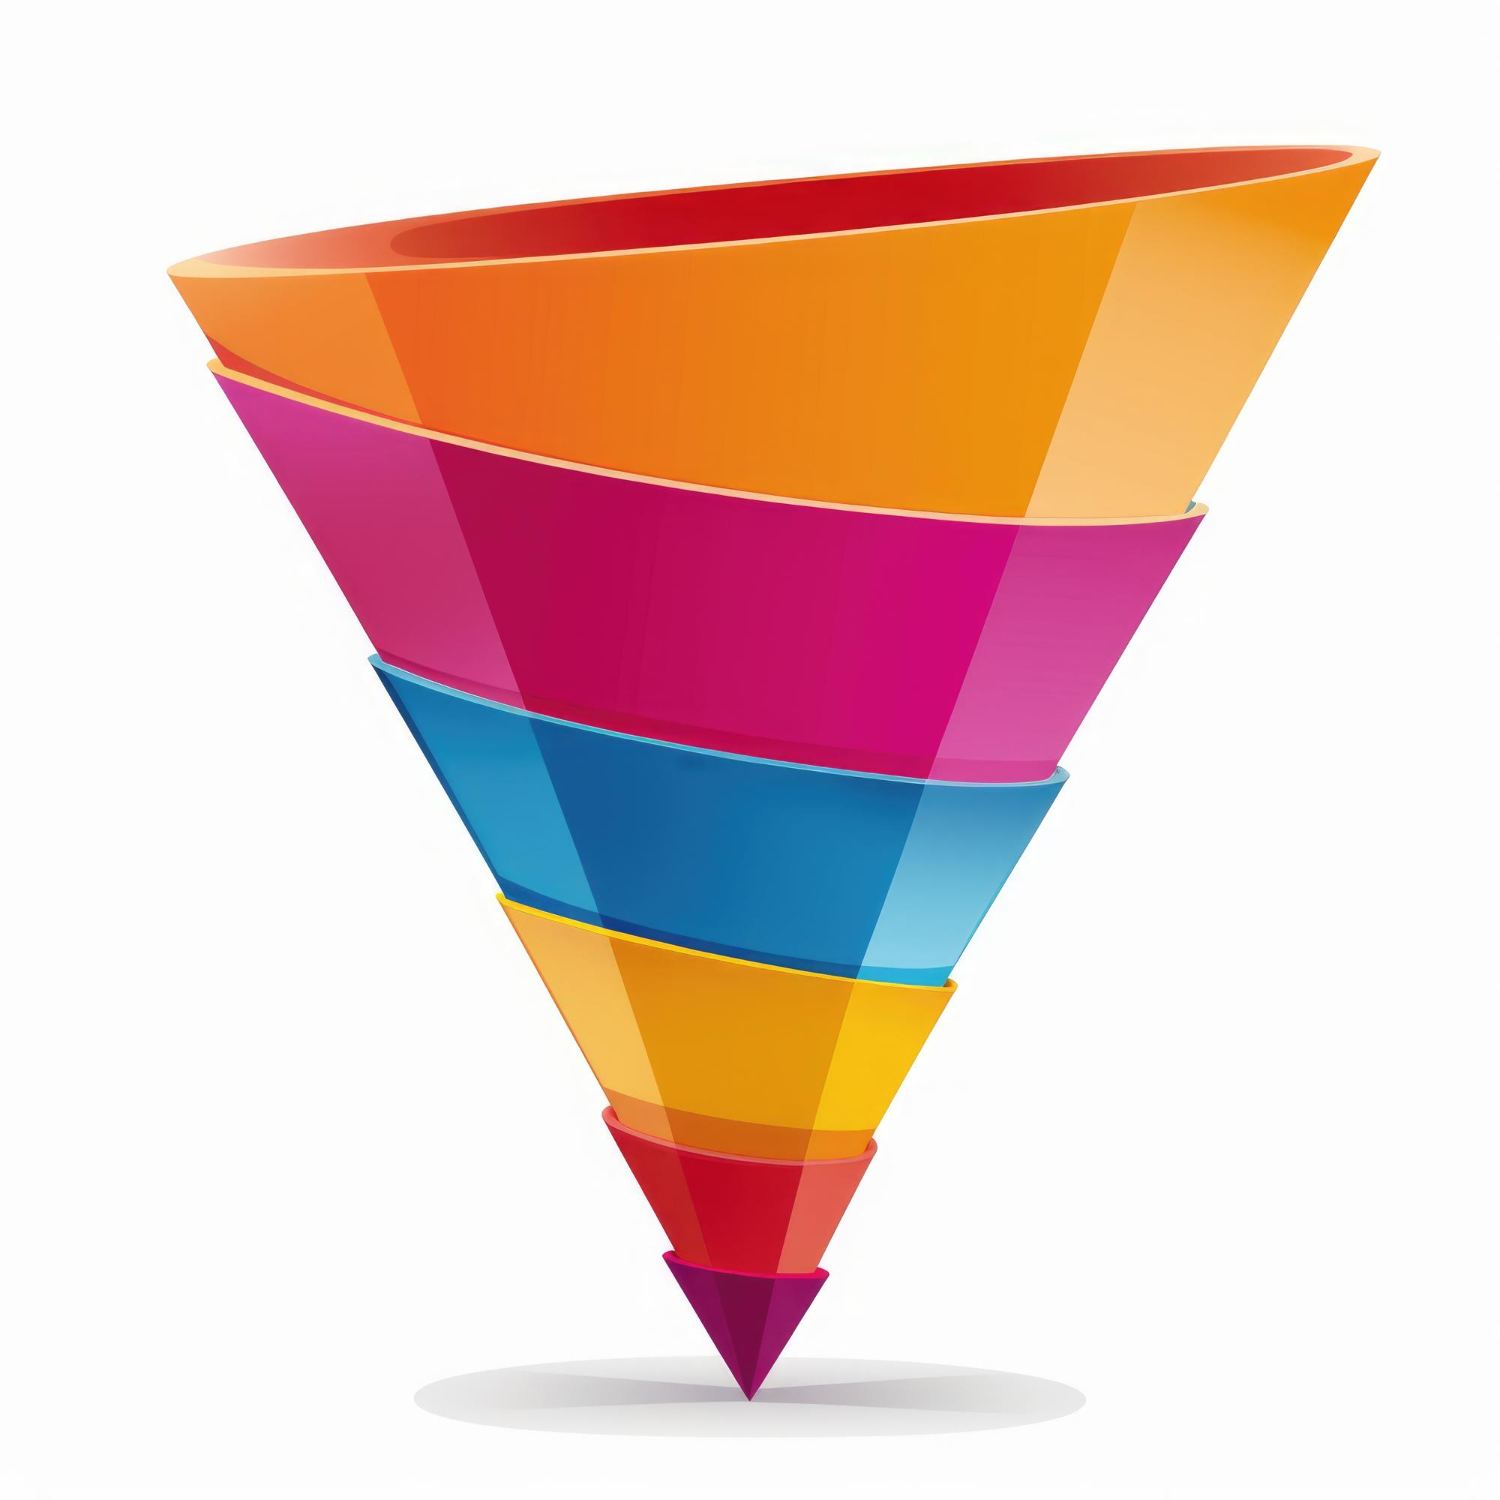
A tracking funnel is a model that breaks the customer journey into stages, from the moment someone first lands on your site to the moment they complete a desired action. The metaphor is simple: wide at the top (lots of visitors), narrow at the bottom (few converters). Your job is to understand why it narrows and make it narrower more slowly.
The classic funnel has four stages:
- Awareness — the visitor arrives and discovers your site exists
- Interest — the visitor engages with content, explores pages, shows intent
- Decision — the visitor evaluates your offering (pricing page, cart, comparison)
- Action — the visitor converts (purchase, signup, contact form submission)
Each stage has specific metrics you can track with tools like Plausible, Matomo, and Umami. The key insight is that you do not need complex funnel visualisation software — you need to know which numbers to watch at each stage and what they mean.
Building Your Funnel: Which Metrics at Each Stage
Before diving into the individual stages, here is an overview of the metrics that define each level of the funnel. This is your reference framework — the numbers you should be tracking in your analytics dashboard.
Let us break each stage down in detail.
Stage 1: Awareness — How People Find You
The top of the funnel is about visibility. Before anyone can buy from you, they need to know you exist. The awareness stage measures how effectively you attract visitors to your site.
Key Metrics
Unique visitors tell you how many individual people reached your site in a given period. This is your reach metric — the total pool of potential customers entering the funnel.
Pageviews count total page loads. A high pageview-to-visitor ratio means people are exploring multiple pages — a good early signal of interest.
Traffic sources reveal where your visitors come from. Are they finding you through organic search, social media, email campaigns, or referral links from other sites? This data is essential because different sources produce visitors with very different intent levels.
What to Watch For
At the awareness stage, you are looking for two things: volume and quality. Volume is straightforward — more visitors means more potential customers entering your funnel. Quality is about whether those visitors match your target audience.
A Melbourne café client of mine was thrilled to see 5,000 monthly visitors until we looked at the geography data. Over 60% of their traffic came from overseas — people who would never walk through the door. The funnel was wide at the top, but it was wide with the wrong people.
Stage 2: Interest — Are Visitors Engaging?
Getting visitors to your site is step one. Getting them to actually engage is step two — and this is where most funnels start to leak. The interest stage measures whether visitors find your content relevant enough to stick around.
Key Metrics
Sessions measure individual visits. A single visitor might have multiple sessions if they return to your site on different days. Growing session counts alongside stable visitor numbers means people are coming back — a strong interest signal.
Bounce rate tells you the percentage of visitors who leave after viewing just one page. A high bounce rate at the interest stage means your content is not compelling enough to keep people exploring. However, context matters — a blog post that fully answers a question may have a high bounce rate and still be successful.
Pages per session indicates how deeply visitors explore your site. For e-commerce, you want this number above 3 — meaning visitors are looking at multiple products or content pages before leaving.
What to Watch For
The interest stage is where you separate casual browsers from potential buyers. Look for patterns in which pages have the lowest bounce rates and highest time-on-page. These are your “sticky” pages — the content that resonates with your audience.
Also pay attention to navigation paths. In Matomo, the Transitions report shows you exactly where visitors go after landing on a specific page. If most visitors hit your homepage and then leave, that is a clear signal your homepage is not effectively guiding people deeper into the funnel.
| Engagement Signal | What It Means | Healthy Benchmark |
|---|---|---|
| Bounce rate below 50% | Most visitors explore beyond the landing page | 30-50% for content sites, 20-40% for e-commerce |
| Pages per session above 3 | Visitors are actively browsing | 3-5 for e-commerce, 2-3 for blogs |
| Returning visitors above 20% | People find your site worth revisiting | 20-40% of total visitors |
| Session duration above 2 min | Visitors are reading, not just glancing | 2-4 minutes for content sites |
Stage 3: Decision — Evaluating Your Offer
The decision stage is where intent becomes concrete. Visitors at this stage are actively evaluating your product or service. They are visiting pricing pages, adding items to carts, reading reviews, or comparing your offering to competitors.
Key Metrics
Pricing page visits — if you have a pricing page, tracking visits to it is one of the strongest intent signals available. Someone who visits your pricing page is seriously considering a purchase.
Cart additions — for e-commerce, add-to-cart events indicate that a visitor has moved from browsing to seriously considering a purchase. Track these as custom events in your analytics tool.
Comparison and review page views — if you have product comparison pages, case studies, or testimonial pages, visits to these pages indicate a visitor gathering information to make a final decision.
What to Watch For
The critical metric at this stage is the drop-off rate between decision and action. If 500 people visit your pricing page but only 10 sign up, that is a 98% drop-off. The question becomes: is the pricing page the problem, or is the traffic quality the issue?
For e-commerce, cart abandonment is the biggest leak in the decision stage. Industry averages sit around 70% — meaning seven out of ten people who add something to their cart leave without buying. Tracking this gives you a clear target for improvement.
Stage 4: Action — The Conversion
The bottom of the funnel is where visitors become customers. This is the moment clicks become conversions — a completed purchase, a submitted form, a confirmed signup.
Key Metrics
Conversion rate is the headline metric. It tells you what percentage of visitors (or sessions) complete your desired action. For most e-commerce sites, a 2-3% conversion rate is healthy. For lead generation, 5-15% is typical depending on your industry and offer.
Revenue per visitor combines your conversion rate with your average order value. If you have 10,000 visitors, a 2% conversion rate, and an average order of $60, your revenue per visitor is $1.20. This metric helps you evaluate whether driving more traffic is worth the cost.
Conversion by source breaks down which traffic channels produce the most conversions. This is where understanding your marketing touchpoints pays off — you can see not just which channels bring visitors, but which channels bring buyers.
Finding and Fixing Funnel Leaks
A “leak” is any point in the funnel where you lose significantly more visitors than expected. Every funnel leaks — that is inevitable. The goal is to find the biggest leaks and fix them first, because that is where you get the most return on effort.
How to Identify Leaks
Start by mapping your actual conversion rates between each stage:
| Funnel Stage | Example Metric | Count | Drop-off |
|---|---|---|---|
| Awareness | Unique visitors | 10,000 | — |
| Interest | Visitors viewing 2+ pages | 4,000 | 60% |
| Decision | Cart additions / pricing views | 800 | 80% |
| Action | Completed purchases | 200 | 75% |
In this example, the biggest leak is at the interest stage — 60% of visitors leave after viewing just one page. This suggests the landing pages are not compelling enough or are attracting the wrong audience. The second biggest leak is at the decision stage, where 80% of engaged visitors do not add anything to cart — possibly a product discovery or pricing issue.
Common Fixes by Stage
Awareness leaks (high bounce rate on landing pages):
- Improve page load speed — every second of delay costs conversions
- Match landing page content to ad or search intent
- Add clear calls to action above the fold
- Check mobile responsiveness — over 50% of traffic is mobile
Interest leaks (low pages per session, short sessions):
- Add internal links to related content
- Use clear navigation that guides visitors to the next step
- Create content that answers follow-up questions
- Add visual elements — tables, images, and formatting that make pages scannable
Decision leaks (pricing page visits but low cart adds):
- Simplify your pricing structure
- Add social proof (reviews, testimonials, case studies)
- Address common objections on the pricing page
- Offer a clear guarantee or return policy
Action leaks (cart adds but low completions):
- Simplify the checkout process — reduce form fields
- Be upfront about shipping costs (surprise costs are the top reason for abandonment)
- Offer guest checkout — do not force account creation
- Add trust signals at checkout (SSL badge, payment logos, return policy)
Setting Up Funnel Tracking in Privacy-First Tools
You do not need enterprise analytics software to build a useful funnel. Here is how to set up basic funnel tracking in the three most popular privacy-first tools.
Plausible
Plausible’s funnel analysis lets you define a sequence of pageview goals and custom events. Create goals for each funnel stage (e.g. homepage visit, product page, add-to-cart event, purchase event), then build a funnel from those goals. Plausible shows the drop-off at each step.
Matomo
Matomo’s Funnels feature (available in the cloud and on-premise versions) provides detailed funnel visualisation. You define the steps as URLs or events, and Matomo calculates conversion and drop-off rates between each step. It also shows where visitors go when they leave the funnel.
Umami
Umami supports funnel analysis through its reporting features. Define URL-based steps for your funnel, and Umami tracks the progression. While simpler than Matomo, it covers the essentials for most small business funnels.
Optimising Your Funnel Over Time
Funnel optimisation is not a one-time project — it is an ongoing practice. Here is the cycle I recommend to my clients:
- Measure — record your current conversion rates at each stage
- Identify — find the stage with the biggest drop-off
- Hypothesise — form a theory about why visitors leave at that stage
- Change — make one improvement (new copy, simplified form, faster page)
- Measure again — wait 2-4 weeks and compare the numbers
- Repeat — move to the next biggest leak
The key is patience. Funnel improvements compound over time. A 5% improvement at each stage does not add up to 20% overall — it multiplies. If your current funnel converts 2% of visitors, improving each of four stages by just 10% would lift your overall conversion rate to roughly 2.9%. That is a 45% increase in conversions from four modest improvements.
Deep Dives: E-commerce and Funnel Articles
This guide gives you the framework. For detailed implementation at each stage, explore these focused articles:
- From Clicks to Customers: How to Map Events to Real Conversions — the complete guide to connecting visitor actions to business outcomes through event mapping
- Cart Abandonment Tracking: What the Numbers Tell You — understanding and reducing the biggest leak in e-commerce funnels
- Marketing Touchpoints: What They Are and How to Track Them — mapping every interaction that influences a customer’s journey through your funnel
For the fundamentals that underpin funnel measurement, start with these:
- What Is a Session in Web Analytics? — understanding the basic unit of website visits
- What Is a Pageview and Why It Still Matters — the simplest metric and why it remains relevant
- Bounce Rate vs Engagement Rate — measuring whether visitors actually engage with your content
- What Is a Traffic Source? — knowing where your funnel traffic originates
- What Is a Unique Visitor? — counting the people entering your funnel
Frequently Asked Questions
How many stages should my funnel have?
Start with 3-5 stages. The classic four-stage model (awareness, interest, decision, action) works for most businesses. E-commerce sites might add a fifth stage for cart behaviour. More than five stages creates noise without adding insight — keep it simple enough to act on.
Can I build a funnel with cookie-free analytics?
Yes, but with a caveat. Cookie-free analytics tracks each session independently, so your funnel measures page-to-page progression within a single visit. You cannot track a visitor who discovers you on Monday and buys on Friday as a single funnel journey. For most businesses, single-session funnels still provide actionable data.
What is a good overall conversion rate?
It depends on your business type. E-commerce sites typically convert 2-3% of visitors. SaaS free trial signups might convert 5-10%. Lead generation forms can convert 10-20%. The most important benchmark is your own historical data — are you improving month over month?
How often should I review funnel data?
Review your funnel monthly. Weekly reviews are fine for high-traffic sites, but for most small businesses, monthly gives you enough data to spot meaningful trends without overreacting to noise. After making a change, wait at least 2-4 weeks before evaluating its impact.
What is the biggest mistake people make with funnel tracking?
Trying to fix everything at once. I have seen businesses redesign their entire checkout flow, change their pricing, update their landing pages, and launch new ad campaigns all in the same month. When conversions change, they have no idea which change caused it. Fix one leak at a time, measure the result, then move on.
Bottom Line
The website tracking funnel is not just a theoretical model — it is a practical framework for understanding where your visitors go and why they leave. By measuring the right metrics at each stage (awareness, interest, decision, action), you can identify the leaks that cost you the most conversions and fix them systematically.
You do not need complex enterprise tools to do this. Plausible, Matomo, and Umami all provide the data you need to build and monitor a conversion funnel. Start by mapping your current numbers at each stage, find the biggest drop-off, and focus your energy there. Small improvements at each stage compound into significant revenue gains over time.
The businesses that grow consistently are the ones that treat their funnel as a living, measurable system — not a one-time setup. Track it, test it, improve it, repeat.