Most teams still obsess over clicks, impressions, and pageviews. Dashboards look busy, charts look “good”, but at the end of the month the only real question is: did these visits turn into customers?
Good conversion analysis in marketing starts with clear business questions, not with picking yet another shiny tool. Numbers like CTR, session duration and conversion metrics are useful, but they’re side characters. The main hero is a clear path from user actions to business value.

In this guide, we’ll walk through a simple way to:
- turn your customer journey into a funnel,
- translate that funnel into events,
- decide which events are “nice behavior” and which are real conversions,
- and use this map to make better decisions, not just prettier reports.
Why clicks and pageviews don’t tell the whole story
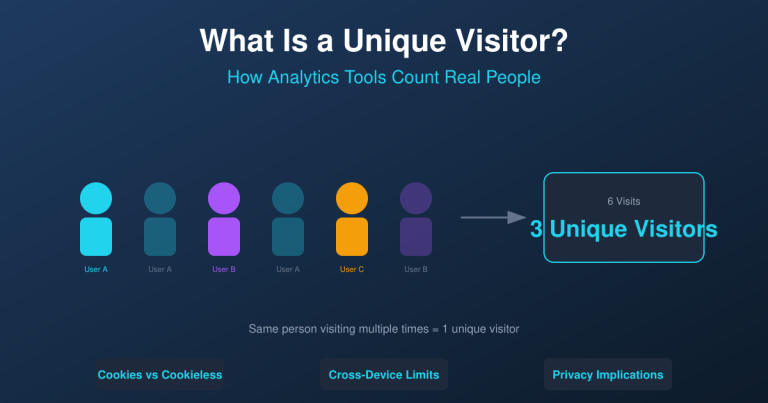
Clicks and pageviews are like checking how many people walked past your shop window. It’s better than nothing, but you still don’t know who came in, who asked a question, and who actually bought. Understanding the difference between unique visitors, sessions, and pageviews is just the starting point.
Here are a few classic “looks good, feels bad” situations:
- Strong ad CTR, weak sales
Your ads get a great click-through rate. Traffic is cheap and plenty. But inside your CRM, new deals per week are flat. Campaign reports say “success”, bank account says “meh”. - Popular blog, empty signup list
Blog posts bring thousands of sessions from organic search. Time on page is high, social shares look nice. But almost nobody signs up for the product demo or newsletter. - Landing page with “great stats”, no revenue
The landing page has a low bounce rate and long session duration. Everyone is happy… until someone asks, “How many of these visitors became paying customers?” Silence.
If your conversion analysis ends at “Campaign A has a 4% signup rate and Campaign B has 3%”, you’re probably missing the real story: what happened between the first click and the final value event?
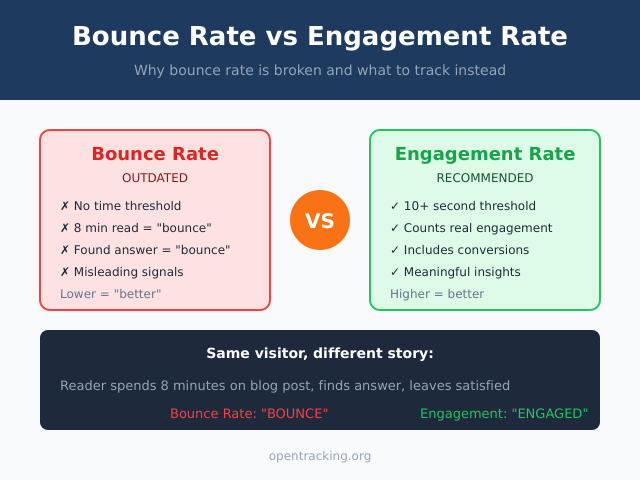
Even basic metrics can be misleading when you look at them in isolation. For example, a low bounce rate can mean users love the page — or that your tracking is broken, or that a simple scroll event fires for everyone. Many teams are slowly moving from raw “bounce” to engagement measurements like bounce rate vs engagement rate, but this still doesn’t answer the main question: did we create customers?

A quick self-check:
- Can you name one event that clearly means “we got business value”?
- Can you draw the main steps users take before that event?
- Can you see where most people drop off?
If you can’t, you don’t have a traffic problem — you have a conversion mapping problem.
Key concepts: events, conversions, micro vs macro
Before we build funnels and tables, let’s align on a few basic ideas.
Events
An event is just a recorded action. For example:
signup_start— user opened the signup formadd_to_cart— user added a product to the cartpricing_view— user viewed the pricing page
Events are the “verbs” of your product. On their own, they’re just facts: “something happened”.
Conversions
A conversion is an event that has special meaning. It is a step where the user moves closer to your business goal, or actually reaches it:
- “Requested a demo”
- “Completed checkout”
- “Subscribed to a paid plan”
In many tools you mark these as “goals” or “conversions”. They’re still events under the hood, but with a label that says “we care a lot about this one”.
Micro vs macro conversions
To keep things simple, I like to separate events into behavior events and micro and macro conversions.
- Micro conversions — small signals of interest or progress:
- scrolling a product page,
- adding to cart,
- starting a trial,
- watching a key feature video.
- Macro conversions — final business outcomes:
- completed purchase,
- signed contract,
- active paid subscription.
You don’t need a long list. You need a clear separation between “this shows interest” and “this creates value”.

Here’s how that often looks for different types of websites:
| Project type | Typical micro conversions | Typical macro conversions |
|---|---|---|
| E-commerce | Product page viewed, add to wishlist, add to cart, start checkout | Order completed, subscription started, high-value order placed |
| SaaS | Pricing page viewed, signup started, onboarding step completed, first key feature used | Free trial started, paid plan activated, contract signed |
| Lead-gen / consulting | Case study viewed, contact page viewed, form started, calendar opened | Form submitted, call booked, proposal accepted |
If you want more inspiration for smaller steps you can track, this list of micro conversion examples is a useful brainstorm starter.
Step 1 — Start with business goals, not tools
Most tracking projects start with a sentence like: “Let’s install GA4” or “Let’s set up the new pixel.” That feels productive, but it’s backwards.
Real conversion analysis in marketing strategy starts from a boring but powerful question: what does success look like for this business?
Some examples:
- For a small online store: “More completed orders with a healthy margin.”
- For a SaaS tool: “More users who pay and actually use the product after 30 days.”
- For a consulting firm: “More qualified leads who show up to calls and sign contracts.”
Only when you know this, it makes sense to talk about events and funnels.
A few questions I like to ask stakeholders:
- What is a successful user for you? Describe them in one sentence.
- What are the one or two actions that clearly mean “this user brought value”?
- What decisions do you want to make from this data? (Change ad spend? Redesign a page? Kill a feature?)
If people struggle to answer, I point them to the idea of clear marketing objectives. When objectives are fuzzy (“do more content”), event tracking becomes fuzzy too (“track everything”).
Once the business goal is clear, you can safely ignore 80% of vanity metrics and focus on the few actions that actually move the needle.
Step 2 — Turn your customer journey into a conversion funnel
Now that you know what “success” means, you can sketch the path a typical user takes to get there. This is your conversion funnel.
A funnel is just a sequence of key steps. Not every click, not every scroll — just the important milestones.
Example funnels
E-commerce store
- Landing page (from ad or search)
- Category page
- Product page
- Add to cart
- Checkout started
- Purchase completed
SaaS product
- Blog post or ad landing
- Signup page
- Account created
- Key onboarding steps completed
- First key action in the product (for example, “created first project”)
- Subscription or upgrade to paid
Lead-gen / B2B service
- Landing page visit
- Scrolled or viewed core content
- Contact form opened
- Contact form submitted
- Call or demo booked
- Contract signed

The goal here is not to be perfect. The goal is to agree on the main staircase users climb before they become customers.
You simply can’t do serious conversion funnel analysis if your “funnel” is just “Traffic → Thank you page”. You’ll see where people enter and exit, but you’ll miss where exactly they lose interest.
If you want more ideas on how to structure funnels, this breakdown of conversion funnel stages is a good visual reference.
Take a sheet of paper (or a whiteboard) and draw your funnel as a row of boxes with arrows. This picture will guide everything we do next.
Step 3 — Translate your funnel into events and conversions
Now let’s turn that pretty funnel into something your tools can understand: events.
Take each step in your funnel and ask: what concrete action on the website or in the product represents this step?
A few examples:
- “Product page viewed” → event
product_view - “Add to cart” → event
add_to_cart - “Checkout started” → event
checkout_start - “Form submitted” → event
lead_submitted - “Subscription activated” → event
subscription_activated
For each event, decide if it’s:
- a behavior event — describes what users do, but not necessarily value;
- a micro conversion — a clear sign of interest or progress;
- a macro conversion — direct business value.
Build a simple tracking spreadsheet
Don’t overcomplicate this. Open a spreadsheet and create an event tracking plan with columns like:
- Step in funnel
- Event name
- Description
- Type (Behavior / Micro / Macro)
- Tools that receive this event (analytics, ad platforms, CRM)
- Notes
If you want a more detailed layout to steal ideas from, this event tracking plan template is a nice reference. But even a small custom table is enough to get started.
Let’s see how this looks for two common cases.
Example event map for an online store
Here’s a simplified mapping:
| Funnel step | Event name | Type | Notes |
|---|---|---|---|
| Category viewed | category_view | Behavior | User is browsing, low intent signal |
| Product page viewed | product_view | Micro | Interest in a specific item |
| Add to cart | add_to_cart | Micro | Stronger intent, can be remarketing signal |
| Checkout started | checkout_start | Micro | User is very close to buying |
| Order completed | purchase | Macro | Core revenue event |
| High-value order | purchase_high_value | Macro | For orders above a certain amount |
Notice how not everything is a macro conversion. If you treat product_view as equal to purchase, every campaign will look “great” and your reports will lie.
Example event map for a SaaS product
For a simple SaaS, the map could look like this:
| Funnel step | Event name | Type | Notes |
|---|---|---|---|
| Signup page viewed | signup_view | Behavior | Top of the signup funnel |
| Account created | signup_complete | Micro | User has an account but might not be active yet |
| Onboarding step completed | onboarding_step_done | Micro | Progress through setup wizard |
| First key action performed | first_key_action | Micro | The “aha” moment (e.g., created first project) |
| Subscription started | subscription_started | Macro | User entered paid plan or active billing |
| Subscription renewed | subscription_renewed | Macro | Ongoing value, useful for retention and LTV tracking |
You can extend this with more events later. Start small, track the basics well, then add detail when you have real questions that need answers.
Step 4 — Choose the right metrics: rate, volume, and quality
Collecting events is easy. Turning them into useful decisions is harder. To keep your reporting sane, think in three dimensions:
- Volume — how many events or conversions happen.
- Rate — what percentage of users move from one step to the next.
- Quality — how valuable those conversions are.
Volume
Volume answers questions like:
- How many signups did we have last week?
- How many purchases came from email?
Volume is a good starting point but often hides problems.
Rate
Rate shows how well each step in the funnel “converts” to the next one.
Simple example:
- 1,000 users view the product page.
- 200 add a product to cart.
- 50 complete the purchase.
Here, the “product view → add to cart” rate is 20%. The “add to cart → purchase” rate is 25%.
If you run conversion rate analysis across your funnel like this, you quickly see where you’re leaking users — even when top-line traffic looks stable.
For a sense of what’s “normal” in different industries, the report behind this conversion rate benchmark can be useful context. Don’t copy the numbers blindly; use them as a sanity check.

Quality
Quality is about what happens after the conversion:
- What percentage of “leads” turn into closed deals?
- How many new subscribers stay after the first month?
- Do customers from Campaign A churn faster than from Campaign B?
You don’t need perfect LTV models to start. Even a simple “lead-to-sale rate by channel” can completely change how you think about performance.
Step 5 — Implement Conversion Tracking in your tools
So far everything has been tool-agnostic on purpose. Now let’s talk about how this mapping becomes reality in your stack.
A typical setup looks like this:
- Website or app — where user actions happen.
- Tag manager or SDK — where events are collected and sent out.
- Web/product analytics — where you explore funnels and cohorts.
- Ad platforms — where you optimize campaigns.
- CRM — where deals, contracts, and long-term value live.
Good Conversion Tracking is not about flipping a single switch in one tool. It’s about making sure all the main tools in your stack understand which events mean “success”.
For example, the same purchase event can be:
- a conversion goal in an analytics tool like GA4,
- a “purchase” event sent back to ad platforms for optimization,
- a “deal won” record in your CRM.
If these three systems disagree on what counts as a purchase (or use different names for the same thing), your reports will fight each other.
A few practical tips:
- Use the same event names across tools where possible.
- Document which events are considered micro and macro conversions.
- Make sure marketing, product, and engineering all sign off on the tracking plan.
As you grow, you might move from simple browser-side tracking to more robust setups like server-side tracking. The core idea stays the same: one clear definition of what a conversion is, flowing through the whole stack.
Step 6 — Run and iterate: making sense of your reports
Tracking is not a one-time project. Once events and funnels are in place, the real work begins: regular review and small improvements.

A simple weekly or bi-weekly routine is enough:
- Check overall health
- Are total macro conversions up or down versus last period?
- Did any channel suddenly spike or drop?
- Scan funnel steps
- Did the rate between any two steps change sharply?
- Did a UX change correlate with a drop on a specific step?
- Compare micro vs macro
- Are micro conversions (like add to cart or trial starts) growing while macro conversions stay flat?
- If yes, maybe traffic is less qualified, or the final steps have friction.
- Look at quality
- Are leads from one channel closing worse than from another?
- Are new subscribers from a recent campaign churning faster?
- Pick one improvement
- Don’t try to fix 10 things at once.
- Choose one step that looks weak and design an experiment or UX tweak there.
If you need help brainstorming what to improve, this list of conversion optimization ideas can give you practical starting points.
The key is to keep the loop small: measure → notice → experiment → learn.
Summary and next steps
Let’s recap the path from clicks to customers:
- Start with business goals, not tools. Decide what “success” means and who a “good user” is.
- Sketch your funnel — the 4–6 key steps people take on the way to that success.
- Translate each step into events, and mark which ones are micro and macro conversions.
- Put everything into a simple tracking spreadsheet so marketing, product, and engineering share the same picture.
- Look at volume, rate, and quality, not just one of them. Use the funnel to spot where you’re losing people.
- Implement events across your stack so analytics, ad platforms, and CRM all agree on what a conversion is.
- Review your reports regularly, ask simple questions, and improve one step at a time.
You don’t need a perfect setup to get value. Pick one product, one landing page, or one funnel. Map the journey, define a handful of events, and start tracking a small set of conversions.