For years, bounce rate was the go-to metric for measuring whether your content was working. High bounce rate? Bad. Low bounce rate? Good. Simple.
Except it was never that simple. And now, with the shift to event-based analytics, bounce rate is officially outdated. Google replaced it with “engagement rate” in GA4. Privacy-first tools like Plausible and Fathom never used it in the first place.
So what should you measure instead? And why did bounce rate fail us? Let’s break it down.
What Is Bounce Rate (And Why It’s Broken)
Bounce rate is the percentage of visitors who land on a page and leave without taking any further action — no clicks, no page views, nothing. It’s calculated at the session level.
The formula is simple:
Bounce Rate = Single-page sessions / Total sessions × 100If 1,000 people visit your blog post and 700 leave without clicking anything else, your bounce rate is 70%.
Sounds useful, right? Here’s the problem:
The Bounce Rate Paradox
Imagine two visitors to your blog post:
Visitor A: Lands on your article, reads the entire thing for 8 minutes, finds exactly what they needed, bookmarks your site, and leaves satisfied.
Visitor B: Lands on your article, realises it’s not what they wanted within 3 seconds, hits the back button immediately.
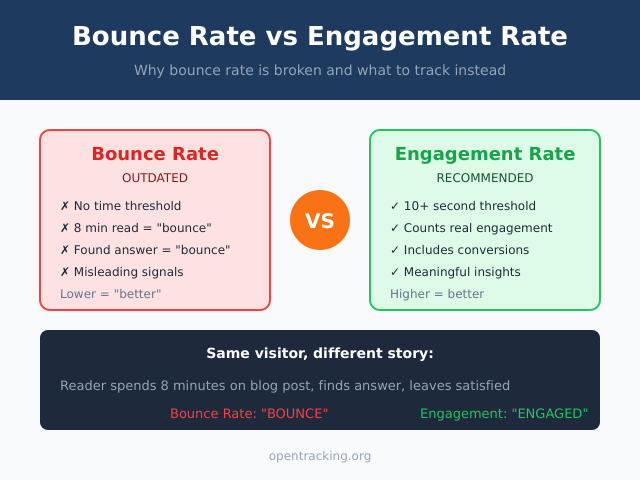
According to traditional bounce rate, both of these count as bounces. The metric treats a deeply engaged reader the same as someone who left in disgust.
This is fundamentally broken.
When Bounce Rate Lies to You
Here are common scenarios where bounce rate gives misleading signals:
| Scenario | What Happened | Bounce Rate Says | Reality |
|---|---|---|---|
| Blog post | Reader spent 6 mins reading | “Bounce” (bad) | Successful content |
| Contact page | User found phone number, called | “Bounce” (bad) | Conversion happened |
| Landing page | Clicked external link to app store | “Bounce” (bad) | Goal achieved |
| Recipe site | Read recipe, cooked dinner | “Bounce” (bad) | Happy user |
| Single-page app | Used app for 20 minutes | “Bounce” (bad) | Highly engaged |
The core issue: bounce rate only measures whether someone clicked something else on your site. It doesn’t measure whether they got value.
Enter Engagement Rate
Engagement rate flips the script. Instead of measuring who left “too quickly,” it measures who stayed long enough to be considered engaged.
In GA4, an “engaged session” is one where the visitor:
- Stayed for 10+ seconds, OR
- Triggered a conversion event, OR
- Viewed 2+ pages
The formula:
Engagement Rate = Engaged sessions / Total sessions × 100Now our two visitors from earlier are treated differently:
- Visitor A (8 minutes reading): Engaged ✓
- Visitor B (3 seconds, left): Not engaged ✗
This is a much better reflection of reality.
Engagement Rate vs Bounce Rate: The Math
Engagement rate and bounce rate are essentially inverses, but not exactly:
| Metric | What It Measures | “Good” Direction |
|---|---|---|
| Bounce Rate | % who left without interaction | Lower is better |
| Engagement Rate | % who meaningfully engaged | Higher is better |
Roughly speaking: Engagement Rate ≈ 100% - Bounce Rate
But there’s a crucial difference: engagement rate has a time threshold (10 seconds by default), while bounce rate had none. This makes engagement rate far more meaningful.
Healthy Benchmarks: What Numbers Should You Expect?
Here’s where people get anxious. “Is my 65% engagement rate good or bad?”
The honest answer: it depends on your content type. Here are realistic benchmarks based on what I’ve seen across client sites:
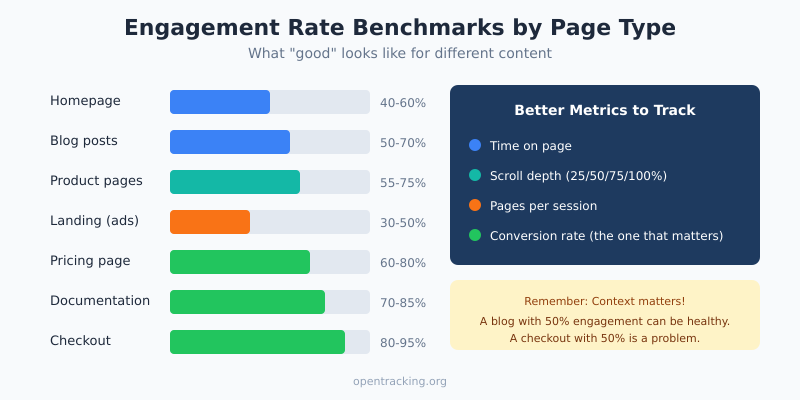
Engagement Rate Benchmarks by Page Type
| Page Type | Typical Engagement Rate | Notes |
|---|---|---|
| Homepage | 40-60% | Many visitors are just browsing |
| Blog posts | 50-70% | Higher for long-form content |
| Product pages | 55-75% | Shoppers tend to browse multiple |
| Landing pages (ads) | 30-50% | Cold traffic, lower intent |
| Pricing page | 60-80% | High-intent visitors |
| Documentation | 70-85% | Users actively seeking answers |
| Checkout | 80-95% | Very high intent |
Old Bounce Rate Benchmarks (For Reference)
If you’re still using tools that report bounce rate, here’s what was considered “normal”:
| Page Type | Typical Bounce Rate | Concern Threshold |
|---|---|---|
| Blog posts | 70-90% | >90% might indicate issues |
| Landing pages | 60-80% | >85% worth investigating |
| E-commerce product | 30-50% | >60% check page speed/UX |
| Service pages | 40-60% | >70% review content relevance |
Important: High bounce rate on blog content was always normal. People find an article via Google, read it, and leave. That’s not failure — that’s how blogs work.
Better Metrics Than Both: What to Actually Track
Engagement rate is better than bounce rate, but it’s still a blunt instrument. Here are more precise metrics that tell you whether your content is working:
1. Time on Page / Average Engagement Time
How long do people actually spend with your content?
| Content Type | Healthy Time | Red Flag |
|---|---|---|
| Short blog (500 words) | 1-2 minutes | <30 seconds |
| Long blog (2000+ words) | 4-7 minutes | <1 minute |
| Product page | 1-3 minutes | <20 seconds |
| Landing page | 30-90 seconds | <10 seconds |
Pro tip: Calculate expected read time (words ÷ 200 = minutes) and compare to actual. If people spend 30% or more of the expected time, your content is landing.
2. Scroll Depth
What percentage of visitors scroll to 25%, 50%, 75%, or 100% of your page?
This is especially valuable for blog content where someone might “bounce” but still read your entire article.
| Scroll Depth | Healthy Benchmark | What It Tells You |
|---|---|---|
| 25% | 70-80% of visitors | Intro hooks them (or doesn’t) |
| 50% | 50-60% of visitors | Content maintains interest |
| 75% | 30-45% of visitors | Strong engagement |
| 100% | 20-35% of visitors | Completed the content |
If there’s a big drop-off at a specific point (say, 40% scroll), look at what’s at that position on your page. Is there a wall of text? A confusing section? An annoying popup?
3. Pages Per Session
How many pages do visitors view before leaving?
- 1.0-1.5: Normal for blogs and content sites
- 2.0-3.0: Good for e-commerce and SaaS sites
- 4.0+: Excellent engagement (or confusing navigation)
Context matters: a blog might naturally have 1.3 pages/session and that’s fine. An e-commerce store with 1.3 pages/session has a problem — people aren’t browsing products.
4. Return Visitor Rate
What percentage of your traffic has visited before?
- 10-20%: Typical for content sites with SEO traffic
- 20-40%: Healthy brand recognition
- 40%+: Strong loyalty (or you’re not reaching new people)
This metric shows whether your content is memorable enough to bring people back. (Learn more about new vs returning visitors.)
5. Conversion Rate (The One That Actually Matters)
Ultimately, engagement metrics are proxies. What you really care about is: did visitors do the thing you wanted them to do? (Learn more about tracking conversions.)
- Newsletter signup
- Product purchase
- Demo request
- Contact form submission
- Free trial signup
A page with “bad” engagement metrics but high conversion rate is actually performing well. Don’t optimise for engagement at the expense of conversions.
How to Track These Metrics (Privacy-First)
Most privacy-focused analytics tools track engagement metrics by default, without needing cookies or invasive tracking.
Plausible
Plausible automatically tracks:
- Time on page
- Scroll depth (in 10% increments)
- Bounce rate (though they recommend focusing on other metrics)
No extra configuration needed — it’s all in the default dashboard.
Fathom
Fathom shows:
- Average time on site
- Pages per visit
- Bounce rate
Their approach: simple metrics that don’t require deep analysis.
Umami
Umami (self-hosted) tracks:
- Visit duration
- Pages per visit
- Bounce rate
- Custom events (with simple code)
Custom Scroll Tracking (If Your Tool Doesn’t Have It)
Here’s a simple script to track scroll depth as custom events:
// Track scroll depth at 25%, 50%, 75%, 100%
const scrollThresholds = [25, 50, 75, 100];
const tracked = new Set();

window.addEventListener('scroll', () => {
  const scrollPercent = Math.round(
    (window.scrollY / (document.body.scrollHeight - window.innerHeight)) * 100
  );

  scrollThresholds.forEach(threshold => {
    if (scrollPercent >= threshold && !tracked.has(threshold)) {
      tracked.add(threshold);
      // Replace with your analytics call
      plausible('Scroll', {props: {depth: threshold + '%'}});
    }
  });
});
When Low Engagement Is Actually Fine
Before you panic about your metrics, consider whether low engagement is actually a problem:
Acceptable “Low Engagement” Scenarios
Contact/Support pages: Someone finds your phone number in 5 seconds and calls. That’s a success, not a bounce.
Reference content: A developer copies your code snippet and leaves. They got what they needed.
News articles: Reader scans headlines, reads one story, leaves. That’s normal news consumption.
Local business sites: Visitor checks your hours/location and leaves. Mission accomplished.
Concerning “Low Engagement” Scenarios
Product pages with <30 seconds average time: People aren’t even reading your product description.
Long-form content with <10% scroll depth at 50%: Your intro isn’t hooking readers.
High-intent pages (pricing, checkout) with high bounce: Something is wrong with UX or trust signals.
Paid traffic with engagement rate under 30%: Your ads are attracting the wrong people, or your landing page doesn’t match the ad promise.
How to Improve Engagement (Practical Tactics)
If your engagement metrics genuinely need improvement, here’s what actually works:
1. Fix Your First 5 Seconds
Most visitors decide whether to stay within 5 seconds. That means:
- Clear headline that matches what they searched for
- No intrusive popups before they’ve seen your content
- Fast page load (under 3 seconds, ideally under 2)
- Above-the-fold content that proves they’re in the right place
2. Match Search Intent
If someone searches “how to fix leaky faucet” and lands on your page, they want:
- Steps to fix a leaky faucet
- Not a 500-word intro about the history of plumbing
- Not a sales pitch for your plumbing services (at least not first)
Give people what they came for, quickly. You can add context and CTAs after.
3. Break Up Your Content
Walls of text kill engagement. Use:
- Short paragraphs (2-4 sentences)
- Subheadings every 200-300 words
- Bullet points and numbered lists
- Tables for comparisons
- Images and diagrams where they add value
4. Add Internal Links (Strategically)
Give engaged readers somewhere to go next:
- Related articles at the end
- Contextual links within content
- “Read next” suggestions
This naturally increases pages per session and signals engagement.
5. Check Page Speed
Slow pages destroy engagement before it can happen:
- Every extra second of load time increases bounce by ~7%
- Test your speed at PageSpeed Insights
- Target: under 2.5 seconds for Largest Contentful Paint (LCP)
Action Steps: Upgrading Your Metrics
Here’s what to do this week:
- Stop obsessing over bounce rate. If your tool shows it, look at it in context, but don’t optimise for it blindly.
- Set up scroll depth tracking if you have content-heavy pages. This reveals where people actually disengage.
- Compare engagement by traffic source. Paid traffic often has lower engagement than organic — that’s expected, not a crisis.
- Identify your worst-performing pages. Sort by engagement rate, look at the bottom 10%, and ask: is this a content problem or a traffic problem?
- Tie engagement to conversions. Do higher-engagement pages convert better? If not, engagement might not be your real issue.
Bottom Line
Bounce rate had a good run, but it’s time to move on. It never told the full story, and in the age of event-based analytics, we have better options.
Engagement rate is a step forward — it at least considers time on page. But the real insight comes from combining multiple signals: scroll depth, time on page, pages per session, and ultimately, conversions.
Don’t chase engagement metrics for their own sake. A 90% engagement rate means nothing if nobody converts. And a 40% engagement rate might be perfectly healthy for a reference page that delivers value quickly.
The goal isn’t to make numbers go up — it’s to understand whether your content is actually helping visitors accomplish what they came to do. Once you frame it that way, the right metrics to track become obvious.